EARTH DAY
NASA’s view of Earth, In Music
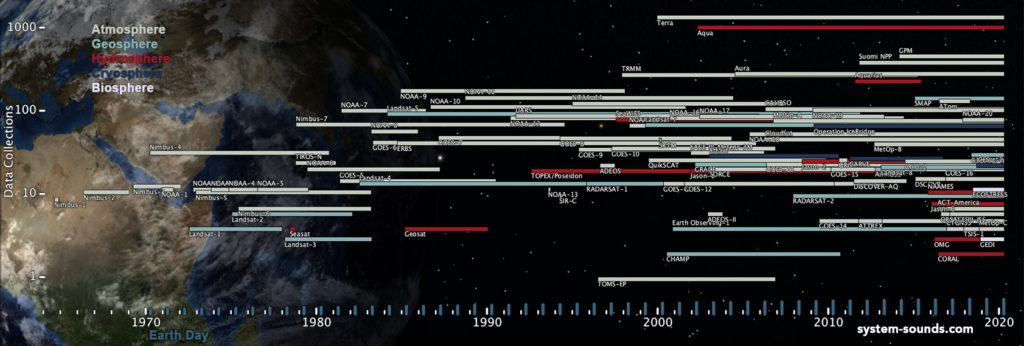
To celebrate the 50th anniversary of Earth Day, NASA asked us to convert their enormous catalog of Earth science data into sound. We started with a list of NASA’s Earth science missions and played a note on a guitar to indicate when they launched. The pitch of the note is determined by the number of data collections you can currently find for each mission at earthdata.nasa.gov. Many collections contain hundreds of thousands of datasets!
Supporting the guitar, an orchestra is split up based on the primary focus of each mission:
- Strings – Atmosphere (ex. Weather, concentrations of various elements and molecules)
- High Woodwinds – Geosphere (ex. land topography, imagery, surface temperatures)
- Low Woodwinds – Hydrosphere (ex. ocean currents, salinity)
- High Brass – Cryosphere (ex. ice cap extent, depths, sea ice)
- Low Brass – Biosphere (ex. vegetation, canopy heights)
Each Earth Day is indicated with a kick drum and a cymbal which get progressively louder as the movement grew. The low drone is created by converting a temperature map of the entire Earth into a sound wave.
The visualization shows a (very) small sample of data from each mission, downloaded and plotted directly from earthdata.nasa.gov. Since some missions study relatively small areas (ex. coral reefs) they may be on the opposite side of the Earth when they appear.
For more info on NASA’s Earth science missions check out Episode 1 of NASA’s Curious Universe!